
![]()
![]()
 |
|
The
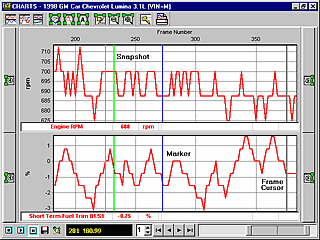
data parameter values are plotted on the vertical axis in reference
to a frame number or a time value on the horizontal axis. The
value of the data parameter at the frame cursor is shown below
each chart beside the parameter name.There are four markers and
four snapshots available. Markers are used to mark the data with
a color line so that the user can easily find that reference point
in the chart screen. A snapshot captures the data values for a
predefined parameter set and sets two colored vertical lines on
the chart to show the starting and ending points of the snapshot.
Markers and snapshot are made by selecting keyboard function keys.
You can take an unlimited number of each.
|
| <<Back | Next>> |
© Copyright 1999 -2001 Innovationhouse.com. All Rights Reserved.
