
![]()
![]()
 |
|
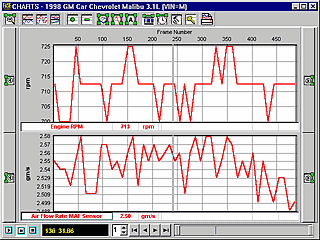
This
screen allows the user to view the vehicle data parameters in
graphical format. Up to 6 graphing windows with graphing auto
scale and various other controls (toolbar buttons) to assist in
different display options are available. Quickly zoom in and pan
to the data you are interested in. Multiple parameters can be
graphed on each axis of each chart. Parameters can be graphed
by time (seconds) or frames. The style, width, and color of the
data and grid lines can be customized. The toolbar displayed at
the bottom of the screen is used to pause the graphing so that
you can scroll through all of the current chart data as well as
any previous data (up to 600 frames) while you are scanning a
vehicle and all of the recorded data while you are playing back
a recording.
|
| <<Back | Next>> |
© Copyright 1999 -2001 Innovationhouse.com. All Rights Reserved.
